Automotive
IVECO
Driving Style
A product evaluation exploring how professional drivers can understand their driving score and act on it.
A score is only useful when people understand what it means.
Driving style evaluation turns vehicle and trip data into feedback on how someone drives. This assignment explored how the IVECO interface could make that feedback easier to understand, with a focus on safety, vehicle use and fuel consumption.
I looked at applications of driving evaluation across delivery, mobility and insurance, including examples involving Amazon, Uber, Generali and UnipolSai. The benchmark explored how products connect scores with specific events, risk alerts and driving behavior.
Connect scores to events
Trip maps and event records provide context for a rating, such as where hard braking occurred.
Show a clear summary
Overall scores offer a starting point before the user explores individual driving indicators.
Explain the behavior
Specific alerts link an observed action to its consequences instead of presenting a number alone.
Three small ambiguities made the interface harder to read.
The review focused on the supplied screen. These are observations from an interface evaluation, rather than findings from user testing.
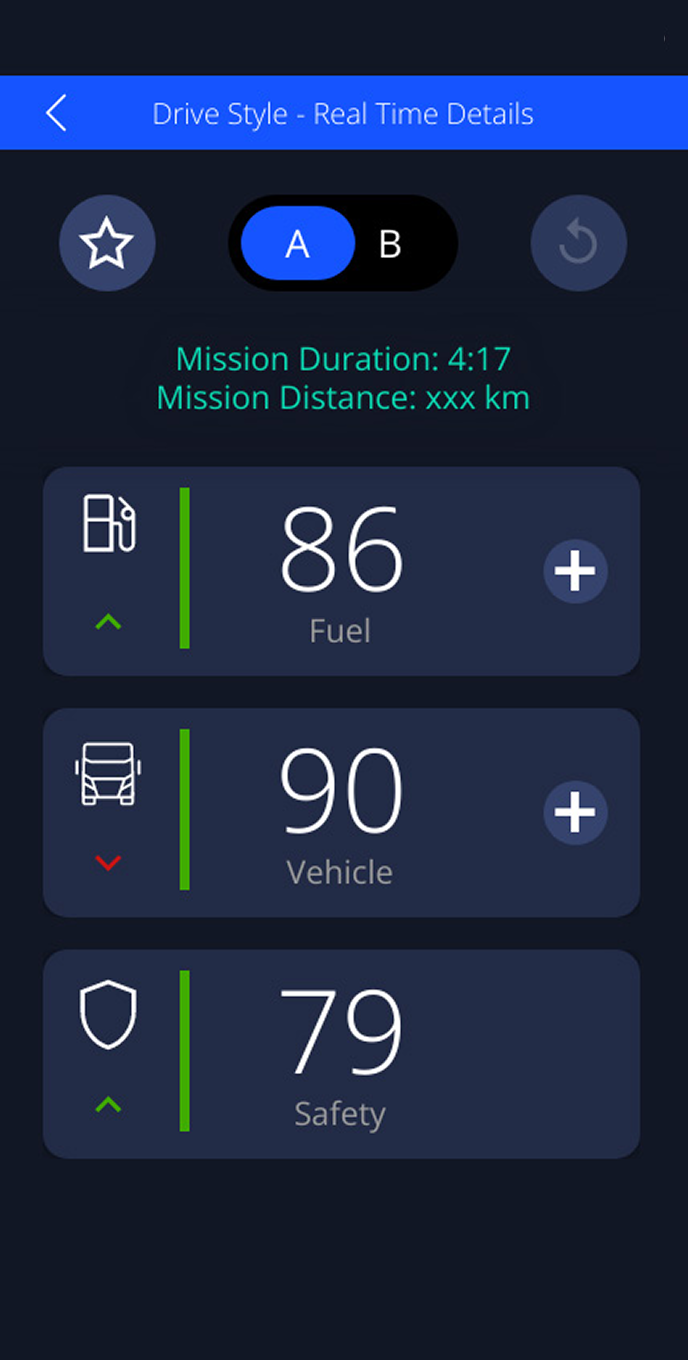
The switch labels provided no indication of what changed between the two views.
The plus button revealed more information, but its symbol could suggest adding something. An expansion control would communicate that behavior more directly.
The small arrows appeared to indicate a trend, yet resembled controls that could be tapped. The distinction between a status indicator and an action was unclear.
Start with the overall picture. Then explain what needs attention.
The concept introduces a clearer reading order: an explicit alert, an overall rating, trip context and expandable categories. It retains the original dark visual language while changing how the information is organized.
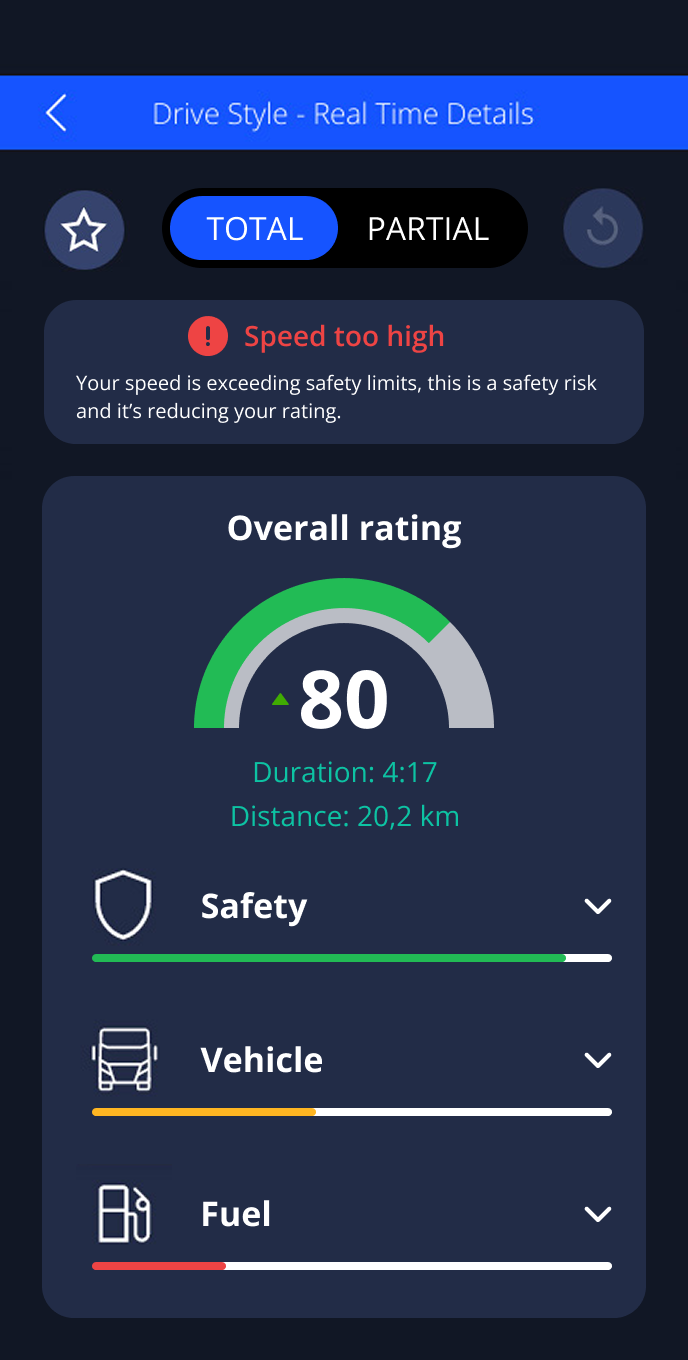
The switch now names the two views. Whether these terms fully explain the scope would still need to be checked with drivers.
The speed alert connects a specific behavior with safety and its effect on the rating.
The overall rating sits above Safety, Vehicle and Fuel. Duration and distance remain visible as context for the trip.
Each category has a consistent control for opening its details, distinct from the visual performance indicators.
Extend feedback beyond a single screen.
The original proposal also included five directions for further exploration. They are product ideas, not implemented features or validated outcomes.
Trip history
Review previous journeys and the events behind their ratings.
Weekly reports
Summarize changes over time and recurring areas for improvement.
Driving tips
Connect performance indicators with practical guidance.
Hands-free guidance
Explore feedback that does not require looking at or touching the screen.
Gamification
Explore goals and progress that encourage safer driving habits.
This concept makes the relationship between evaluation and design decisions explicit. The next step would be to test comprehension of the labels, rating and category controls with drivers, and assess when and how feedback should be delivered to avoid adding distraction.